Crystallography: Introduction to X-Ray Diffraction Chemistry Tutorial
Key Concepts
- Crystallography is the study of the arrangement of atoms, or ions, in solids.
- X-ray crystallography is the study of crystal structures using X-ray diffraction techniques.
- X-ray diffraction is a technique used to provide information about the internal structure of crystalline substances.
- X-rays have wavelengths of the same order of magnitude as inter-atomic distances so they undergo diffraction due to their interaction with regularly arranged atoms, or ions, within a crystal.
- Diffraction of X-rays produces a pattern that is characteristic of the crystal structure.
- Analysis of recorded X-ray diffraction patterns provide information about:
(i) the distance between layers of atoms in a crystalline substance
(ii) the number of atoms or ions in the unit cell
(iii) the total symmetry of the lattice
- Analysis of X-ray diffraction patterns also provides information about regions of high and low electron density within a molecule or ionic compound so that electron density maps can be produced.
- These electron density maps are used to indicate the arrangement of atoms, or ions, within compounds.
- X-ray diffraction has played a significant part in the elucidation of the structures of important biological molecules such as:
⚛ DNA
⚛ vitamin B12
⚛ haemoglobin
⚛ insulin
Please do not block ads on this website.
No ads = no money for us = no free stuff for you!
Understanding X-Ray Diffraction by Crystals
X-rays were discovered by Wilhelm Röntgen in 1895, but it took some time before we understood that they were part of the electromagnetic spectrum, as shown in the diagram below:
| |
Electromagnetic Spectrum |
| |
long-wave radio |
radio broadcast band |
1 shortwave radio TV |
microwaves |
infrared |
visible |
UV |
x rays |
γ rays |
| wavelength, m |
|
106 |
|
104 |
|
102 |
|
1 |
|
10-2 |
|
10-4 |
|
10-6 |
10-7 |
10-8 |
|
10-10 |
|
10-12 |
|
10-14 |
|
10-16 |
|
X-rays are waves. They have a wavelength of about 10-10 m.
1 wavelength is the distance between 2 adjacent peaks, or between 2 adjacent troughs, as shown in the diagram below:

The wavelength of X-rays is much shorter than the wavelength of visible light which is between about 4 × 10⁻⁷ m and 7 × 10⁻⁷ m.
Because X-rays have a shorter wavelength than visible light it means that X-rays have higher energy than visible light since the energy of electromagnetic radiation is inversely proportional to its wavelength:
| energy |
∝ |
1
wavelength |
| E |
∝ |
1
λ |
E = energy in J
λ = wavelength in m
|
The constant of proportionality is Planck's constant (h) multiplied by the speed of light (c) so:
| E |
= |
hc
λ |
|
E = energy in J
h = Planck's constant = 6.63 × 10⁻³⁴ J s
c = velocity of light ≈ 3 × 10⁸ m s-1
λ = wavelength in m
|
Because X-rays have more energy than longer wavelength electromagnetic radiation like visible light, it means that X-rays have greater penetrating power.
X-rays can penetrate paper, wood and flesh but not bone, which is one of the reasons we can use them to take images of the inside of our bodies; X-rays of your bones can show up breaks, X-rays of your mouth show your teeth embedded in your jaw bone.
If you grew a crystal of apatite, the calcium mineral found in bone, you could use X-rays to determine the structure of the mineral because the distance between atoms or ions in a crystal lattice and the wavelength of X-rays are of the same order, about 10-10m.
This enables us to use X-rays to study the structure of crystals using an apparatus such as is shown in the schematic diagram below:
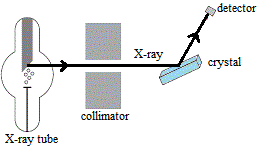 |
- X-ray tube produces a beam of monochromatic X-rays.
- Beam of X-rays enters the collimator which contains slits turning the beam of X-rays into a thin pencil line of X-rays.
- These collimated X-rays are directed onto a crystal.
- X-rays are diffracted, bent, by the crystal.
- Detector records the diffraction pattern.
|
If you used photograph film to record the diffraction pattern of a crystalline substance such as apatite, or copper sulfate (CuSO4.5H2O) like Max von Laue's graduate students Friedrich and Knipping did in 1912, you end up with an image of regularly spaced spots on a background as shown below:
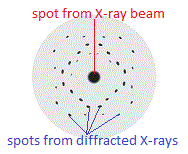
The location of the spots on the photographic film, known as a Laue pattern, depends upon the relative locations of the atoms, or ions, in the crystal lattice.
The spots are regularly arranged because the atoms, or ions, in the crystal lattice are regularly arranged.
But where do these spots on the photographic film come from?
X-rays are waves so when the collimated X-rays hit the atoms in the crystal, or more precisely their electrons, they are absorbed and then re-emitted(1).
Some of these re-emitted X-ray waves reinforce each other when they arrive at the photographic film so that the heights(2) of their combined, or resultant, wave increases(3):
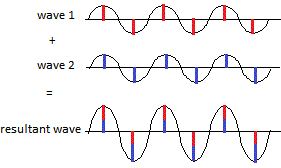
and we see a bright spot on the film. This is called constructive interference, a new wave is constructed with the same wavelength as the original collimated X-ray beam but the height of the peaks and troughs have increased.
Some of the re-emitted X-ray waves cancel each other out when they arrive at the photographic film because the peak of one wave corresponds to the trough of another wave as shown in the diagram below:
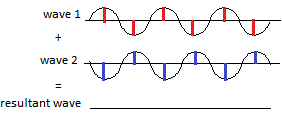
and they do not make a spot on the film. This is called destructive interference, the wave has been destroyed.
This tells us that we will see a bright spot on the photographic film if the X-ray waves arrived at the film in phase, that is the peaks of one wave correspond with peaks of the other wave and the troughs of one wave correspond with troughs of the other wave, so that the 2 waves reinforce each other to produce a bright spot.
Measuring the Distance Between Atoms in a Crystal Lattice Using X-Ray Diffraction
Father and son team, William and Lawrence Bragg, realised that X-ray diffraction could be used to analyse the structure of crystals.
A crystal lattice is a regular arrangement of atoms, ions, or molecules, in 3 dimensions.
In the schematic diagram below, dots are used to represent the location of atoms in 2 layers of a crystal lattice.
The distance between the 2 layers of atoms in the crystal lattice is represented by d.

To measure the distance between the layers of atoms in the lattice, the Braggs treated each layer of atoms in the lattice like a mirror, so that when we hit this layer of atoms with 1 X-ray wave, shown in red in the diagram below:

the incident X-ray wave of wavelength λ hits one of the "mirrors" at an angle θ and is then reflected off this top "mirror", also at an angle θ due the law of reflection (angle of incidence = angle of reflection).
Since there are no other waves in this scenario, this X-ray wave would arrive at the photographic film and make a spot.
Now, imagine there are 2 parallel X-rays with same wavelength, λ, and the same peak/trough height hitting the crystal at the same angle, θ.
In the diagram below these are labelled X-ray 1 and X-ray 2.
X-ray 1 reflects off top layer "mirror", while X-ray 2 reflects off the bottom "mirror" at a distance d from the top "mirror":
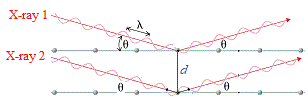
X-ray 2 which has traveled inside the crystal has actually traveled a further distance than X-ray 1.
In the diagram below we are highlighting the incident wave front using green lines to match up the parallel nodes on each incident wave, and we are highlighting the reflected wave front using purple lines to match up the parallel nodes on each reflected wave.
We can easily see that there is an "unmatched" node for X-ray wave 2 because it has traveled further than X-ray wave 1:
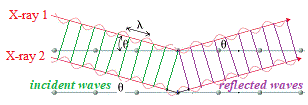
Let's take a closer look at the area around the unmatched node by magnifying the image:
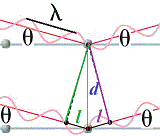
d is the distance between the layers of atoms in the lattice (the "mirrors"), and l is the extra distance traveled by X-ray 2 on its way through the crystal before it reflects off the "mirror", l is the extra distance traveled by X-ray wave 2 after being reflected off the "mirror" deeper inside the crystal.
The total extra distance traveled by X-ray 2 is l + l = 2l
For these 2 waves, X-ray 1 and X-ray 2, to arrive at the film in phase, the extra distance that X-ray 2 has traveled must be an integral number of wavelengths, that is,
extra distance traveled by X-ray 2 = nλ
since the extra distance = 2l we can write:
2l = nλ
where n = an integer (1, 2, 3, etc)
Using trigonometry we can find the relationship between the angle θ, the distance between the layers in the crystal, d, and the extra distance traveled by the incident X-ray 2 on its journey through the crystal to the "mirror", l:
l = dsinθ
which we can then substitute into the the equation 2l = nλ so:
2dsinθ = nλ
which is known as Bragg's Law, or the Bragg equation, after William Bragg who discovered this relationship.
The Bragg equation tells us that for any distance between layers of the crystal lattice d, diffraction can occur at several angles, θ.
Each angle corresponds to a different value of n.
When n=1 we refer to this as the first-order diffracted ray (first order diffraction)
When n=2 we refer to this as the second-order diffracted ray (second order diffraction)
etc, etc
We can re-arrange Bragg's Law to find the distance between layers of atoms in the crystal, d:
Using the Bragg equation, we build up a 3-dimensional picture of how the layers of atoms are arranged in the crystal.
Worked Example: Determining Interatomic Distance in a Crystal Using Bragg's Law
Question: A sodium chloride crystal, NaCl(s), was investigated in an X-ray diffraction experiment.
The wavelength of the X-rays used in the experiment was 1.54 × 10⁻¹⁰ m.
First-order diffraction occurred at an angle of 22.77°.
Calculate the distance between the layers of atoms in the sodium chloride crystal.
Solution:
(Based on the StoPGoPS approach to problem solving.)
- What is the question asking you to do?
Calculate the distance between the layers of atoms
d = ?
- What data (information) have you been given in the question?
Extract the data from the question:
λ = wavelength of X-rays = 1.54 × 10⁻¹⁰ m
θ = angle of incidence = 22.77°
n = 1 (first-order diffraction)
- What is the relationship between what you know and what you need to find out?
- Substitute in the values and solve the equation to find d
| d |
= |
nλ
2sinθ |
| |
= |
1 × (1.54 × 10-10)
2 × (sin22.77) |
| |
= |
1.54 × 10⁻¹⁰
2 × 0.387 |
| |
= |
1.54 × 10⁻¹⁰
0.774 |
| |
= |
1.99 × 10⁻¹⁰ m |
- Is your answer plausible?
Have we answered the question that was asked?
Yes, we have calculated the distance between the layers of atoms.
Is our answer reasonable?
X-rays are diffracted by crystals because the distance between the atoms in the crystal lattice is of the same order of magnitude as the incident X-rays.
The distance, d, we calculated is about 10-10 m, and the incident X-rays had a wavelength of about 10-10m so our answer is reasonable.
Work backwards: use the calculated value of d, the known values for λ and θ to calculate n and hence the order of diffraction:
2dsinθ = nλ
2 × 1.99 × 10-10 × sin22.77 = n × 1.54 × 10⁻¹⁰
1.54 × 10-10 = n × 1.54 × 10⁻¹⁰
(1.54 × 10⁻¹⁰) ÷ (1.54 × 10⁻¹⁰) = n = 1
When n=1 this is first-order diffraction
Since this agrees with the order of diffraction given in the question, we are confident that our answer is plausible.
- State your solution to the problem "distance between layers of atoms":
d = 1.54 × 10⁻¹⁰ m
X-Ray Diffraction and Electron Density Maps
In reality, all those spots in the Laue diffraction pattern are the result of the incident X-rays interacting with each atom's, or ion's, electrons.
So, the more electrons there are, the more interactions we expect.
Analysing all the information contained in an X-ray diffraction pattern requires some pretty hefty mathematics, but it results in the production of an electron density map for the crystal.
That is, we can determine regions within the crystal structure that contain a high density of electrons and regions where there is a low density of electrons.
Atoms, or ions, with a large number of electrons will be more effected by incident X-rays than atoms with a smaller number of electrons.
The hydrogen atom with just 1 electron is extremely difficult to map using this technique.
Recall that the quantum mechanical model of an atom tells us the probability of finding an electron within a volume of space around the atom's nucleus which is referred to as "probability density".
We can assign a "probability density" to a number of points in space in order to define the "probability density distribution" for this region of space.
When we multiply this "probability density distribution" by the number of electrons in an atom, the result is known as the "electron probability distribution" or just as "electron density".
This electron density can be thought of as a cloud of negative charge that varies in density throughout the crystal.
A common way to represent electron density is to use a contour map in which lines join points of equal electron density.
You are probably already familiar with contour maps.
For example, on a weather map the curved lines (isobars) join points with same air pressure so this is a contour map of Earth's air pressure.
If bush-walking is your thing, you will probably have used a topological map on which the contour lines join up points with the same elevation (height above sea level).
A steep sided hill has the contour lines close together, but a gentle slope has the contour lines spread out over a larger area of the map.
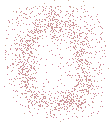
If you were to produce a contour map of a single, isolated atom you would see a set of concentric circles, which, in theory, would extend outward infintely:
| probability density |
|
electron density map |
 |
|
 |
The electron density for an atom is higher near the atom's nucleus and becomes lower in regions further from the nucleus.
Theoretically, the electron density for an atom extends outwards to infinity.
The circles close to the location of the atom's nucleus (the centre of the concentric circles) are contour lines joining points of the same high electron density, while circles further away from the nucleus are contour lines joining points of the same lower electron density.
Note that the contour lines are NOT the same as Bohr's orbits, NOR do they represent a quantum mechanical orbital.
The contour lines join positions of equal electron density.
The electron density map for a single, isolated ion of an element would look similar to that for an isolated atom, just rings of concentric circles.
If the crystal being investigated by X-ray diffraction is a purely ionic substance, made up of positively charged cations and negatively charged anions held together in the lattice solely by electrostatic attraction, then we expect to see rows of cations and anions in a regular arrangement, each cation and each anion represented by a set of concentric circles.
The "charge cloud" of one ion will not overlap the "charge cloud" of another ion, so the electron density map of one ion is not changed by the proximity of other ions.(4)
Shown below is the electron density map for a particular ionic compound:
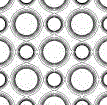
We can see there are "large circles" and "small circles" representing the two different ions (one a cation and the other an anion). Each "large circle" is surrounded by 4 "small circles", and each "small circle" is surrounded by 4 "large circles" so the ratio of "small circles" to "large circles" is 1:1 and the ionic formula for this ionic compound is MX (where M represents a metal ion and X represents a non-metallic ion).
Now, what would happen to the the contour lines on the electron density map if the "charge cloud" of one atom overlapped the "charge cloud" of another atom?
First, let's think about metals.
A crystal of a pure metallic element is made up of a regular 3-dimensional lattice of identical atoms so in a 2-dimensional representation of a layer of metal atoms we expect to see rows of identical sets of concentratric circles.
But there is a little bit more to this picture because the atoms in the metallic lattice are held together by metallic bonds, delocalised electrons that wander between the atoms.
Electrons close to the nucleus are tightly bound to it, so the electron density of a metal atom is high near the nucleus and the electron density map will show contour lines as concentric rings close to each nucleus.
But further away from each nucleus the electrons are less tightly bound and are free to move because there is some overlap of the "charge clouds" associated with adjacent metal atoms.
This overlap of "charge clouds" has a profoud effect on the electron density map of the metallic crystal.
Let's consider an idealised scenario in which just 2 identical metal atoms interact to produce a metallic bond.
We are going to assign some fairly arbitrary numbers to the contour lines representing points of corresponding electron density.
0.8 represents a high electron density and is seen close to the nucleus of an atom, while 0.2 represents a low electron density and is found on the contour line furthest from the the nucleus.
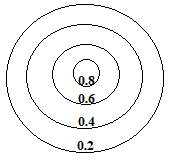
When we bring 2 of these metal atoms close enough to form a metallic bond, the outer areas of the "charge cloud" of each atom overlap, which we will represent as an overlap of the 0.2 contour lines for each atom as shown below:
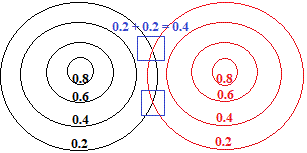
At the intersection of the two contour lines, shown surrounded by a blue square in the diagram above, the electron density has been increased from 0.2 to 0.4.
So, we draw a new electron density map to show how the overalap of "charge clouds" has influenced the electron density around both atoms:
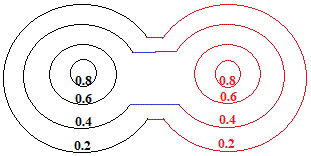
In reality, the metallic crystal contains many billions of atoms, and the outer limits of the "charge clouds" of adjacent atoms are all overlapping, so we could represent a section of one layer of metal atoms in the metallic lattice as shown below:
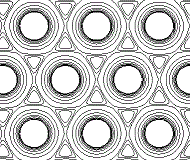
The electron density map of a metal still shows concentratic circles of higher electron density close to each atom's nucleus, but, further away from the nucleus the contour lines form an envelope surrounding adjacent atoms in the lattice.
The "charge clouds" of the atoms overlap in regions of low electron density.
The electron density map for a molecule would look quite different.
Consider a molecule made up of 2 identical non-metallic atoms.
They form a covalent bond when the "charge clouds" of the two atoms overlap.
This overlap results in regions of increased electron density between the two atoms, which all sounds very much like metallic bonding discussed above, EXCEPT that a molecule is a discrete unit, in this case, it is made up of just 2 identical atoms, so ONLY these 2 "charge clouds" interact.
Close to the nucleus of each atom, the contour lines form concentric circles of equal high electron density, but, further away from the nucleus where the electron density is lower the contour lines start to form an envelope around the adjacent atoms as shown below:

If we connect the centres of the 2 sets of concentric circles, we could determine the distance between the 2 nuclei, that is, we could determine the bond length, as shown as a red line in the diagram below:

For molecules made up of more than 2 atoms, we can even determine the bond angles between the atoms in that plane as shown in the diagram below:
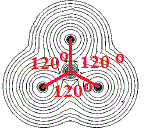
The molecule above is known to be a planar molecule, all the atoms lie in the same plane.
It is made up of a central non-metallic element, let's call it X, surrounded by 3 identical non-metallic atoms, which we will call Z, so it has the molecular formula XZ3.
The angle between adjacent X-Z bonds shown in red is 120°, we say that the bond angles are all 120°
Footnotes:
(1) Compare this to how emission spectra are obtained.
(2) The "height" of wave is referred to as its amplitute. Physics students may be familiar with this term.
(3) Physics students may be familiar with this, it is called the superposition.
(4) Yes, we are taking a very idealised view of ionic bonding here!


