Please do not block ads on this website.
No ads = no money for us = no free stuff for you!
High Performance Liquid Chromatography Techniques
A schematic diagram of the HPLC apparatus is shown below:
| |
Step 1:
Sample
Injection |
Step 2:
Separation
in Column |
Step 3:
Detection & Recording |
 |
A typical HPLC column is only 150 to 250 mm long with an internal diameter of up to 4.6 mm which is packed with tiny silica (glass) particles.
The solvent, mobile phase, is forced from the mobile phase reservoir through the HPLC apparatus under pressures of up to 400 atmospheres (40,520 kPa or about 40 MPa) using a pump.
This allows the column to be packed with very small particles, around 5 μm, which provides a huge surface area for the stationary phase.
The larger the surface area of the stationary phase, the greater the chances of the sample components interacting with, adsorbing on, the surface of the stationary phase so the better the separation of components will be.
Step 1: Sample Injection
The sample solution is injected through an injection port using a syringe, typically a microsyringe which is a syringe with a very small total volume which is measured in microlitres, μL (1 μL = 10-6 L = 10-3 mL).
In HPLC, very small volumes of sample solution are used, for example, 1 μL
The injected sample solution mixes with the mobile phase (solvent) and together they are forced through the column under pressure.
Step 2: Separation in the Column
Separation of the components in the mixture depends on their different abilities to adsorb onto the stationary phase and desorb or dissolve in the mobile phase.
In normal phase HPLC the mobile phase is non-polar and the stationary phase is polar so:
- the more polar components in the mixture will adsorb more strongly to the polar stationary phase and be less attracted to the non-polar mobile phase
(polar components will be retained in the column for a longer time than the non-polar components)
- the less polar components in the mixture will adsorb less strongly to the polar stationary phase and be more attracted to the non-polar mobile phase
(non-polar components will be retained in the column for a shorter time than the polar components)
In the more common reverse phase HPLC the mobile phase is polar and the stationary phase is non-polar so
- the more polar components in the mixture will adsorb less strongly to the polar stationary phase and be more attracted to the non-polar mobile phase
(polar components will be retained in the column for a shorter time than the non-polar components)
- the less polar components in the mixture will adsorb more strongly to the polar stationary phase and be less attracted to the non-polar mobile phase
(non-polar components will be retained in the column for a longer time than the polar components)
| Polarity of Components in a Mixture |
|---|
| polar component | non-polar component |
|---|
t
y
p
e
| Normal phase HPLC
-polar stationary phase
-non-polar mobile phase | Adsorbs strongly to stationary phase.
Retained in column for long time.
Large Rt | Adsorbs weakly to stationary phase.
Retained in column for short time.
Small Rt |
|---|
Reverse phase HPLC
-non-polar stationary phase
-polar mobile phase | Adsorbs weakly to stationary phase.
Retained in column a short time.
Small Rt | Adsorbs strongly to stationary phase.
Retained in column a long time.
Large Rt |
|---|
Step 3: Detecting and Recording Results
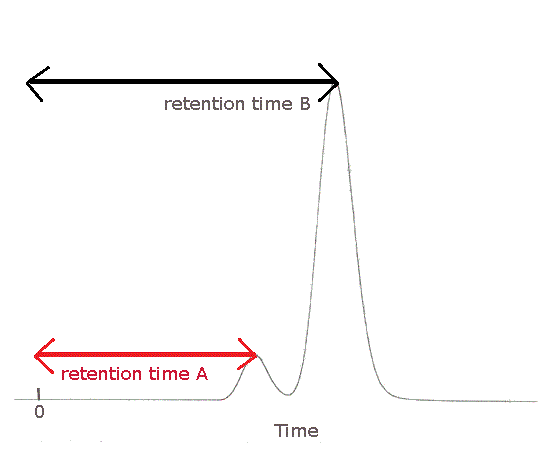
The time taken for each component in the sample to reach the detector is known as its retention time, Rt.
Retention times are different for different for different substances.
During a particular HPLC experiment, retention times are influenced by:
- the pressure used (this affects the solvent's flow rate)
- nature of the stationary phase (its polarity as well as the size of the particles used in the column)
- composition of the solvent (polar, non-polar, mixtures of polar and/or non-polar solvents)
- temperature of the column
As components exit the column they enter the detector.
Many different kinds of detectors are used, one of the most common is a UV absorption detector because most medium to large molecules absorb UV radiation at a particular wavelength.
Other kinds of detectors may detect a change in refractive index or the fluorescence after excitation with a particular wavelength.
The components of the mixture reach the detector at different times due to differences in the time they are retained in the column.
The component that is retained the shortest time in the column is detected first.
The component that is retained the longest time in the column is detected last.
The detector sends a signal to the chart recorder which results in a peak on the chart paper.
The component that is detected first is recorded first.
The component that is detected last is recorded last.
The HPLC chromatogram (chromatograph) below shows 2 peaks due to different substances in the mixture.
Substance A was the first to emerge from the column, the first to be detected and the first to be recorded.
Substance A was retained the shortest period of time in the column.
Substance A has the shortest retention time, Rt.
Substance A is less strongly attracted to the stationary phase.
|
 |
Substance B was the last to emerge from the column, the last to be detected and the last to be recorded.
Substance B was retained the longest period of time in the column.
Substance B has the longest retention time, Rt.
Substance B is most strongly attracted to the stationary phase.
|
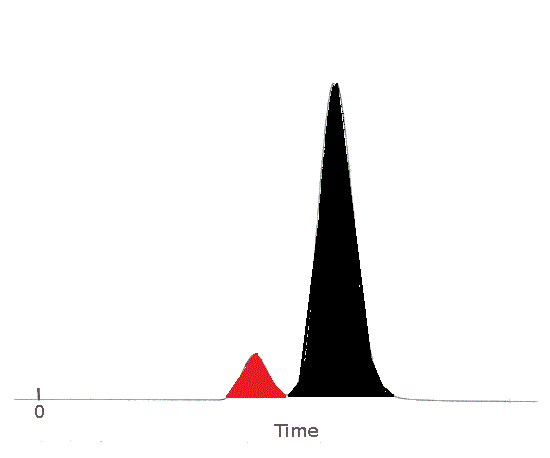
If it is known that the two substance behave in a similar way in the column and in the detector, then it is possible to compare the area under each peak in order to comment on the relative concentration of each component in the original sample.2
| The area of the peak for Substance A has been shaded in red.
Substance A's peak area is less than Substance B's peak area.
The sample contained less Substance A than Substance B.
|
 |
The area of the peak for Substance B has been shaded in black.
Substance B's peak area is greater than Substance A's peak area.
The sample contained more Substance B than Substance A.
|
1. The name was changed from high pressure to high performance liquid chromatography as improvements in the overall performance were not restricted to just increasing the pressure, but also to improvements in the injection systems, detectors and columns.
Since 2004, further advances have led to columns with even smaller particles, 1.7 μm, and pressures of 1,000 atmospheres (101,300 kPa), and a new name, ultra high performance liquid chromatography (UHPLC), sometimes the Waters Corporation trademarked name ultra performance liquid chromatography (UPLC) is used.
2. For example, if one of the substances absorbs more UV light in the detector than the other substance, then the peak areas are due not only to the relative concentration of each substance but also to their relative abilities to absorb UV light!


