Acid-Base Conductometric Titrations Chemistry Tutorial
Key Concepts
⚛ A solution conducts electricity if there are mobile ions in solution.
This solution is referred to as an electrolytic solution.
⚛ Some ions are more mobile in solution than others:
(i) H+(aq) is more mobile than other cations.
(ii) OH-(aq) is more mobile than other anions.
⚛ For dilute aqueous solutions(1) at the same concentration and temperature:
(i) A strong acid conducts electricity well because of the higher concentration of very mobile H+(aq)
(ii) A weak acid conducts electricity less well because of the lower concentration of very mobile H+(aq)
(iii) A strong base conducts electricity well because of the higher concentration of very mobile OH-(aq)
(iv) A weak base conducts electricity less well because of the lower concentration of very mobile OH-(aq)
⚛ In an acid-base conductometric titration the changes in the conductivity of the solution, its conductance, is measured as the base is gradually added to the acid (or as acid is added to base).
⚛ The results of the acid-base conductometric titration are graphed resulting in conductance curves.
⚛ The shapes of some typical acid-base titration conductance curves are shown below:
| Typical Conductance Curves for Acid-Base Titrations |
|---|
Strong Acid-
Strong Base |
 |
Well-defined endpoint
(at intersection of 2 lines) |
|---|
Strong Acid-
Weak Base |
 |
Well-defined end point
(at intersection of 2 lines) |
|---|
Weak Acid-
Strong Base |
 |
Poorly-defined end point
(beyond minimum conductance) |
|---|
Weak Acid-
Weak Base |
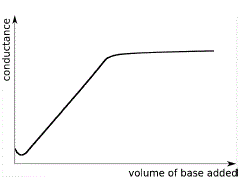 |
Well-defined end point
(at intersection of 2 lines) |
|---|
⚛ The end point(2) of these acid-base conductometric titrations is where 2 straight lines intersect.
⚛ The end point as determined by the conductance curve corresponds to the equivalence point for the acid-base reaction.
⚛ The volume of base needed to neutralise all the acid can then be read straight off the conductance curve using the end point.
⚛ Stoichiometry can then be used to calculate the concentration of the unknown base (or acid).
At the equivalence piont:
moles(H+(aq)) = moles(OH-(aq))
c(H+(aq)) × V(H+(aq)) = c(OH-(aq)) × V(OH-(aq))
where
c = concentration in mol L-1
V = volume in L
Please do not block ads on this website.
No ads = no money for us = no free stuff for you!
Mobility of Ions and Conductivity
A dilute aqueous solution of acid conducts electricity because the acid will dissociate to produce ions in solution:
A strong acid, HA(aq), is said to fully dissociate into hydrogen cations, H+(aq), and anions, A-(aq), as shown in the balanced chemical equation below:
HA(aq) → H+(aq) + A-(aq)
A weak acid, HA(aq), is said to partially dissociate into hydrogen cations, H+(aq), and anions, A-(aq), so that the undissociated acid is in equilibrium with its ions as shown in the balanced chemical equation below:
HA(aq) ⇌ H+(aq) + A-(aq)
At the same concentration and temperature, dilute aqueous solutions of strong acid will conduct electricity better than dilute aqueous solutions of weak acid because there is a greater concentration of ions in the strong acid solution.
We say that the conductance of the strong acid solution will be greater than the conductance of the weak acid solution.
Similary, the conductance of a dilute aqueous solution of strong base will be greater than the conductance of a dilute aqueous solution of weak base at the same concentration and temperature.
The conductance of an electrolytic solution such as dilute aqueous solutions of acid or base at any temperature depends only on the ions present, and therefore varies with their concentration.
When a solution of an electrolyte is diluted further, the conductance will decrease, since there are fewer ions per mL of solution present in the solution to carry the current.
The conductivity of a solution also depends on the identity of the ions present.
Some ions, like H+(aq) and OH-(aq), are much more mobile than others, so under the same conditions solutions of H+(aq) or OH-(aq) will conduct an electrical current better than solutions of other ions.
The table below lists the conductance of aqueous solutions of some cations and anions at 25°C:
| Conductance of Cations and Anions in Aqueous Solution at 25°C (3) |
|---|
| Cation |
Conductance |
Trend |
Anion |
Conductance |
|---|
| H+ |
349.8 |
high |
OH- |
198.3 |
| K+ |
73.5 |
↓ |
Br- |
78.1 |
| NH4+ |
73.5 |
↓ |
I- |
76.8 |
| Ag+ |
61.9 |
↓ |
Cl- |
76.3 |
| Na+ |
50.1 |
↓ |
NO3- |
71.5 |
| Li+ |
38.7 |
↓ |
F- |
55.4 |
| |
|
low |
CH3COO- |
40.9 |
Notice that the conductance of H+(aq) and OH-(aq) is much, much greater than the conductance of other cations and anions.
The ions H+(aq) and OH-(aq) are more mobile in solutions than other cations and anions so they conduct an electric current better than other ions.
The mobility of ions in aqueous solution is effected by temperature.(4)
The mobility of ions increases as temperature increases, so the conductance of the solution will increase with increasing temperature, so it is important that the contents of a conductivity cell attain thermal equilibrium before proceeding with the conductance experiment.
It is also important to note that the conductance of a weak acid or weak base is largely dependent on the degree of dissociation (degree of ionisation) which is itself temperature dependent(5), another good reason for making sure the contents of the conductivity cell attains thermal equilibrium before proceeding with the conductance experiment.
↪ Back to top
Experiment: Acid-Base Conductometric Titration
You should already have completed an acid-base titration experiment using equipment similar to that shown below:
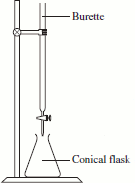
If the burette was filled with base then the conical flask (erlenmeyer flask) contained acid and a drop of acid-base indicator.
If the burette was filled with acid then the conical flask contained base and a drop of acid-base indicator.
The reagent from the burette is gradually added to the reagent in the concial flask until the indicator changes colour (the end point of the titration experiment).
In an acid-base conductometric titration we use changes in the electrical conductivity of the solution in the conical flask to detect the end point of the titration rather than an acid-base indicator.
An aqueous solution of an acid, HA(aq), will conduct electricity because it dissociates into hydrogen ions (H+(aq)) and anions (A-(aq)).
HA(aq) ⇌ H+(aq) + A-(aq)
H+(aq) ions will be much more mobile than A-(aq) ions in the solution.
An aqueous solution of a base, BOH(aq), will conduct electricity because it dissociates into hydroxide ions (OH-(aq)) and cations (B+(aq)).
BOH(aq) ⇋ B+(aq) + OH-(aq)
OH-(aq) ions will be much more mobile than B+(aq) ions in the solution.
During an acid-base titration there will be changes in the conductivity of the solution reflecting the changing concentration of ions in solution, especially the changes in the concentration of highly mobile ions like H+(aq) and OH-(aq).
There are different ways to measure the electrical conductivity of a solution.(6)
You could set up the titration as shown above and insert a conductivity probe into the solution and use a data logger to record conductivity and volume of reagent added.
You may have access to "conductivity cells" in your lab that have been designed for conductometric titrations.
If you do not have access to that kind of equipment, then you could use the apparatus shown below to measure the changes in conductance of a solution as base in the burette is added to acid in the beaker (or, as acid in the burette is added to base in the beaker):
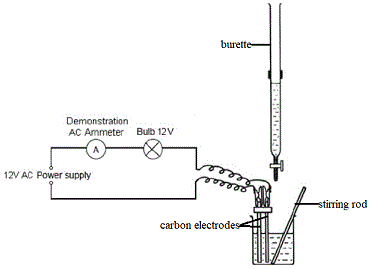
In this experiment we are using inert carbon electrodes to ensure there is no reaction between the electrodes and the solution which would interfer with the conductivity measurements.
Changes in the conductance of the solution in the beaker will be registered by the ammeter, the greater the reading on the ammeter the greater the conductivity of the solution.
When the conductivity of the solution is high, the bulb will glow brightly, but when the conductivity of the solution is low the bulb will glow less brightly.
You might also note the use of a beaker (instead of the conical flask, or erlenmeyer flask, you probably used in acid-base titrations using an acid-base indicator to detect the endpoint of the titration).
Because we need to insert the electrodes into the solution we need a vessel with a wider mouth, a beaker is often the best available option in the school laboratory.
In the diagram above we are going to stir the solution with a stirring rod to ensure complete mixing after each addition from the burette, but you may have access to a magnetic stirrer instead.
We use AC rather than DC to prevent electrolysis of the solution which would effect the measurement of the conductivity of the solution.
Note that as we add reagent from the burette to the beaker we are increasing the volume of solution in the beaker, reducing the concentration of species in the solution.
We minimise this effect by using a more concentrated solution in the burette so as we add reagent from the burette to the beaker the volume of solution in the beaker is not increased by very much.
We record the volume of reagent added from the burette in mL and the resulting reading on the ammeter.
We can then graph the results of our conductometric acid-base titration: conductance on the y-axis and volume of reagent added on the x-axis.
The shape of the resulting graph will reflect the strength of the acid and strength of the base used in the conductometric titration experiment.
↪ Back to top
Acid-Base Conductance Curves

We will set up our acid-base conductometric titration as shown below:
The beaker contains a specified volume of dilute aqueous solution of acid.
The burette contains a dilute aqueous solution of base.
Base from the burette will be added 1 mL at a time to the acid solution, stirred, then the reading on the ammeter recorded beside the total volume of base added so far.
| Results Table |
|---|
volume
(mL) |
Conductance
(amp) |
|---|
| 0.00 |
|
| 1.00 |
|
| 2.00 |
|
| etc. |
|
We will consider the following types of acid-base conductometric titrations:
- Strong acid and strong base conductometric titration
- Strong acid and weak base conducotmetric titration
- Weak acid and strong base conductometric titration
- Weak acid and weak base conductometric titration
When we graph the results of our acid-base conductometric titrations, what will the conductance curves look like?
Strong Acid - Strong Base Conductance Curves
HCl(aq) is a strong acid.
In dilute aqueous solution, HCl(aq) fully dissociates into H+(aq) cations and Cl-(aq) anions according to the balanced chemical equation below:
HCl(aq) → H+(aq) + Cl-(aq)
HCl(aq) conducts electricity because there are lots of mobile ions in solution that act as charge carriers.
The conductance of HCl(aq) will be high.
NaOH(aq) is a strong base.
In dilute aqueous solution, NaOH(aq) fully dissociates into Na+(aq) cations and OH-(aq) anions according to the balanced chemical equation below:
NaOH(aq) → Na+(aq) + OH-(aq)
NaOH(aq) conducts electricity because there are lots of mobile ions in solution that act as charge carriers.
The conductance of NaOH(aq) will be high.
If we set up a conductometric titration experiment in which we gradually add NaOH(aq) to HCl(aq) then intially the conductance of the solution is high due to the presence of dissociated HCl(aq) as H+(aq) cations and Cl-(aq) anions.
As we add NaOH(aq) to the HCl(aq) in excess, some of the highly mobile H+(aq) are removed because they react with the OH-(aq) to produce water (H2O(l)) according to the following balanced chemical equation:
H+(aq) + OH-(aq) ⇌ H2O(l)
The dissociation constant for water is small (Kw = 10-14 at 25°C) so very few of the water molecules dissociate, a negligle number in comparison to the contribution of ions due to the HCl(aq) and NaOH(aq), so we will ignore it.
When we add a small amount of base to the acid, keeping the HCl(aq) in excess, the solution contains Cl-(aq), Na+(aq), but, there will be a decreased number of highly mobile H+(aq).
Because the concentration of highly mobile H+(aq) has decreased, the conductance of the solution decreases.
The conductance of the solution will continue to decrease as we add NaOH(aq) to HCl(aq) until it reaches a minimum at the equivalence point.
At the equivalence point, all the highly mobile H+(aq) have reacted with all the added OH-(aq), so, in solution we only have the less mobile ions Na+(aq) and Cl-(aq), so the conductance of the solution will be at its lowest which will be the end point for this titration.
With further additions of NaOH(aq) past the equivalence point the conductance of the solution will increase.
When the NaOH(aq) is in excess the solution contains highly mobile OH-(aq), more OH-(aq) results in better conductance of the solution.
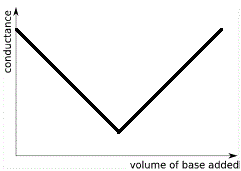
The graph below shows the shape of the conductance curve when strong base is added to strong acid:

Note the following features:
- When 0 mL of strong base have been added to the strong acid the conductance is high due to maximum concentration of highly mobile H+(aq).
- While H+(aq) is in excess, the conductance decreases as all the added OH-(aq) reacts with some of the H+(aq) to produce H2O(l). The concentration of highly mobile H+(aq) decreases so conductance decreases.
- Conductance is at a minimum at the equivalence point because the concentration of highly mobile H+(aq) and OH-(aq) ions in solution is at its lowest (their concentrations now due only to the extremely minute degree of dissociation of water), while there is a preponderance of less mobile ions so the conductance is at its lowest point.
- Past the equivalence point there is an excess of strong base, so the concentration of highly mobile OH-(aq) increases with each addition of strong base and the conductance of the solution increases.
The end point of the conducotmetric titration is the point at which the 2 straight lines on the graph above intersect (which coincides with the minimum conductance on our graph).
Reading off the graph will give the volume of base required to neutralise all the acid, the equivalence point of the neutralisation reaction.
If you were to add strong acid to strong base, the resulting conductance curve would have the same general shape as the curve above.
Strong Acid - Weak Base Conductance Curves
If you were to add a weak base, like an aqueous solution of ammonia (NH3(aq)) or ammonium hydroxide (NH4OH(aq)), to a strong acid, like sulfuric acid (H2SO4(aq)), then the shape of the conductance curve will be quite different to the shape of the curve for a strong-acid - strong base conductometric titration.
Sulfuric acid, H2SO4(aq), is strong diprotic acid, we will assume that it fully dissociates in water to produce highly mobile H+(aq) and less mobile SO42-(aq) as shown in the balanced chemical equation below:
H2SO4(aq) → 2H+(aq) + SO42-(aq)
Dilute H2SO4(aq) is a good conductor of electrical current because the solution contains a high concentration of highly mobile H+(aq).
In aqueous solution, some of the ammonia molecules react with water in a proton transfer reaction to produce ammonium ions and hydroxide ions as shown in the balanced chemical equation below:
NH3(aq) + H2O(l) ⇌ NH4+(aq) + OH-(aq) Kb = 1.8 × 10⁻⁵
But, because the value for the base dissociation constant (Kb) is small, this reaction does not occur to an appreciable extent so the concentration of NH4+(aq) and OH-(aq) is low.
So an aqueous solution of ammonia, NH3(aq), can be thought of as an aqueous solution of ammonium hydroxide in which the concentration of NH4+(aq) and OH-(aq) is very low because the base dissociation constant for this reaction is very small:
NH4OH(aq) ⇌ NH4+(aq) + OH-(aq)
When NH3(aq) (represented by NH4OH(aq)) is added to H2SO4(aq) the following reaction takes place:
H2SO4(aq) + 2NH4OH(aq) → 2H2O(l) + 2NH4+(aq) + SO42-(aq)
So, as we add weak base to the strong acid the conductance of the solution will initially be high but will decrease as highly mobile H+(aq) are removed from the solution during the formation of H2O(l).
At the equivalence point, all the available highly mobile H+(aq) will have been removed by the reaction with the weak base so the conductance of the solution will reach a minimum.
Past the equivalence point the weak base (NH4OH(aq)) will be in excess, but, because it is a weak base it will dissociate very little in the solution resulting in the addition of very few ions to the solution so the conductance of the solution may remain effectively unchanged.
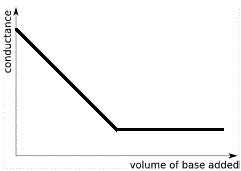
The graph below shows the conductance curve resulting from a conductometric titration in which a weak base is added to a strong acid.

Note the following features:
- When 0 mL of weak base have been added to the strong acid the conductance is high due to maximum concentration of highly mobile H+(aq).
- While H+(aq) is in excess, the conductance decreases as all the added OH-(aq) reacts with some of the H+(aq) to produce H2O(l). The concentration of highly mobile H+(aq) decreases so conductance decreases.
- Conductance is at a minimum at the equivalence point because the concentration of highly mobile H+(aq) and OH-(aq) ions in solution is at its lowest (their concentrations now due to the extremely minute degree of dissociation of water), while there is a preponderance of less mobile ions so the conductance is at its lowest point.
- Past the equivalence point there is an excess of weak base, but, because the base is weak and dissociates very little in aqueous solution, the concentration of ions in solution does not change appreciably and past the equivalence point the curve may appear to be almost horizontal.
The end point of this conductometric titration is the point at which the 2 straight lines on the graph above intersect.
The volume of base required to neutralise all the acid at the equivalence point for the acid-base reaction can be read off the graph.
Weak Acid - Strong Base Conductance Curves
Acetic acid (ethanoic acid), CH3COOH(aq), is a weak acid, its acid dissociation constant is very small (Ka = 1.8 × 10⁻⁵) so very few of the acetic acid molecules dissociate in water to produce highly mobile hydrogen ions, H+(aq), and much less mobile acetate ions, CH3COO-(aq).
CH3COOH(aq) ⇌ H+(aq) + CH3COO-(aq) Ka = 1.8 × 10⁻⁵ (at 25°C)
| Ka |
= |
[H+(aq)][CH3COO-(aq)]
[CH3COOH(aq)] |
= |
1.8 × 10⁻⁵ |
The conductivity of a dilute solution of acetic acid will be much lower than the conductivity of a strong acid at the same concentration and temperature because the concentration of ions in solution will be much lower.
A dilute solution of aqueous sodium hydroxide, NaOH(aq) is a strong base, it fully dissociates into highly mobile hydroxide ions, OH-(aq), and less mobile sodium ions, Na+(aq), as shown by the balanced chemical equation below:
NaOH(aq) → Na+(aq) + OH-(aq)
The conductance of dilute NaOH(aq) will be high, higher than for dilute acetic acid at the same concentration and temperature.
As NaOH(aq) is added to CH3COOH(aq), the following reaction occurs:
CH3COOH(aq) + NaOH(aq) → CH3COO-(aq) + Na+(aq) + H2O(l)
Initially, the addition of a very small amount of NaOH(aq) to CH3COOH(aq) will decrease the concentration of highly mobile H+(aq) in solution because the production of acetate ions, CH3COO-(aq), will repress the dissociation of acetic acid:
| Ka |
= |
[H+(aq)][CH3COO-(aq)]
[CH3COOH(aq)] |
= |
1.8 × 10⁻⁵ |
The value for Ka does not change, but initially the concentration of CH3COO-(aq) will increase as NaOH(aq) is added (prior to the equivalence point).
The system will adjust by consuming some of this new acetate by reacting with some of the available H+(aq) to increase the concentration of undissociated acetic acid molecules (CH3COOH(aq)) in order to re-establish equilibrium.
Initially, the concentration of highly mobile H+(aq) decreases and hence the electrical conductivity of the solution decreases.
As more and more NaOH(aq) is added to the CH3COOH(aq) which is still in excess, the concentration of ions in solution, Na+(aq) and CH3COO-, becomes much greater than the concentration of H+(aq) due to the acid dissociation, so the electrical conductivity of the solution increases once again.
So there are 2 opposing influences at work on the system, reaction with base to decrease the concentration of acetic acid and hence decrease the ions in solution due to acid dissociation and hence decrease the conductance of the solution, and, an increase in ions in solution due to the production of a soluble salt which increases the acetate ion concentration and hence increases the conductance of the solution.
Past the equivalence point, the NaOH(aq) is in excess with the concentration of highly mobile OH-(aq) increasing with each addition of strong base so the conductance of the solution increases.
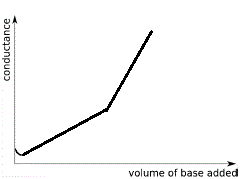
The graph below shows the changes in conductivity of the solution when a strong base is added to a weak acid in a conductometric titration:

Note the following features:
- When 0 mL of strong base have been added to the weak acid the conductance is low due to the low concentration of highly mobile H+(aq).
- Initially, while weak acid is in enormous excess, the conductance decreases as all the added OH-(aq) reacts with some of the CH3COOH(aq) to produce H2O(l). The concentration of highly mobile H+(aq) decreases so conductance decreases.
- Conductance reaches a minimum (which may not be visible on your graph) but this is not the end point.
- As the concentration of weak acid decreases, there is a significant increase in the ion concentration of the solution due the soluble salt produced, hence conductance of solution increases in a linear fashion.
- Past the point of minimum conductance (if shown) there will be change in the graph, a break in the line which might be very difficult to see, which represents the end point for the titration.
- Past the equivalence point of the neutralisation reaction there is an excess of strong base, the concentration of highly mobile ions in solution, OH-(aq), increases so the conductance of the solution increases.
Because OH-(aq) is much more mobile than the other ions in solution, the conductance of the solution increases at a greater rate than before, that is, the slope of this part of the graph will be greater than before.
The end point is the point on the graph where the rather indistinct break between the 2 straight line occurs. This can be very difficult to find!
We have exaggerated this break on our graph above so that you can see it.
Reading off the graph at this end point you will determine the volume of strong base that was added to neutralise all the weak acid.
Weak Acid - Weak Base Conductance Curves
A dilute aqueous solution of acetic acid, CH3COOH(aq), is a weak acid (Ka = 1.8 × 10⁻⁵).
The dissociation of acetic acid occurs to only a small extent, so few highly mobile H+(aq) are present in the solution so the conductance of the solution is low.
A dilute aqueous solution of ammonia, NH3(aq), is a weak base (Kb = 1.8 × 10⁻⁵).
We will represent this aqueous solution of ammonia as ammonium hydroxide, NH4OH(aq), but very few ammonium ions and hydroxide ions are present in the solution so the conductance of this solution is also low.
When NH4OH(aq) is added to CH3COOH(aq) the following reaction occurs:
NH4OH(aq) + CH3COOH(aq) ⇌ NH4+(aq) + CH3COO-(aq) + H2O(l)
The conductance curve for the addition of a dilute aqueous ammonia solution to a dilute aqueous solution of acetic acid is shown below:

Note the following features:
- The curve resembles the weak acid - strong base conductance curve in the previous section up to the end point for the titration.
- Past the equivalence point for the neutralisation reaction, the addition of more weak base (NH4OH(aq)) has little impact on the conductance of the solution since its dissociation is depressed by the presence of ammonium ions, NH4+(aq), already present in the solution.
- The end point for this weak acid - weak base titration experiment is much easier to detect than for the weak acid - strong base titration experiment we saw in the section above.
Using an acid-base indicator to detect the endpoint of weak acid- weak base titration is extremely difficult, but using a conductometric titration the endpoint of a weak acid - weak base titration is easy to detect.
The end point for this titration experiment occurs at the intersection of the 2 straight lines in the graph.
We can determine the volume of weak base needed to neutralise all the weak acid at the equivalence point for the neutralisation reaction by reading it straight off the graph.
↪ Back to top


