Emission Spectroscopy or Atomic Spectroscopy Chemistry Tutorial
Key Concepts
- An emission (atomic) spectrum is produced when a gas is heated.
- The atoms in the gas absorb energy, causing some electrons to move from the lower energy ground state to a higher energy excited state.
excited state -------- higher energy electron absorbs
energy↑
|
|
|
|
|ground state -------- lower energy - These excited electrons will fall back to the lower energy ground state and emit the energy they had previously absorbed.
excited state -------- higher energy electron emits
(releases) energy|
|
|
|
|
↓ground state -------- lower energy - The energy released corresponds to particular wavelengths (and frequencies) of light.

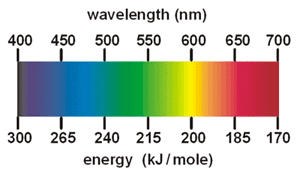
The greater the energy released, the shorter the wavelength of light emitted.1 - This emitted light can be viewed through a spectroscope to produce a line emission spectrum, a series of coloured lines on a dark background.
- The line emission (atomic) spectrum of an element is unique.
- Line emission spectra (atomic spectra) can be used to identify the presence of an element in a sample because no two elements produce the same line emission (atomic) spectrum.
